


Find keyword wins, losses and opportunities
Use the Keywords tabs to see what gained or lost clicks this week, which queries are new, how brand and non-brand traffic compare, and where search demand is peaking.
3 min read · Last updated November 12, 2026

The main Keywords tab tells you what is happening. The tabs next to it tell you what changed and where to act. This guide walks through four of them using SEOcrawl AI's own project.
Top Changes: what moved this week
Open Keywords and select Top Changes. The table compares two periods of the same length, for example the last 7 days against the 7 days before, and lists the keywords that moved the most.
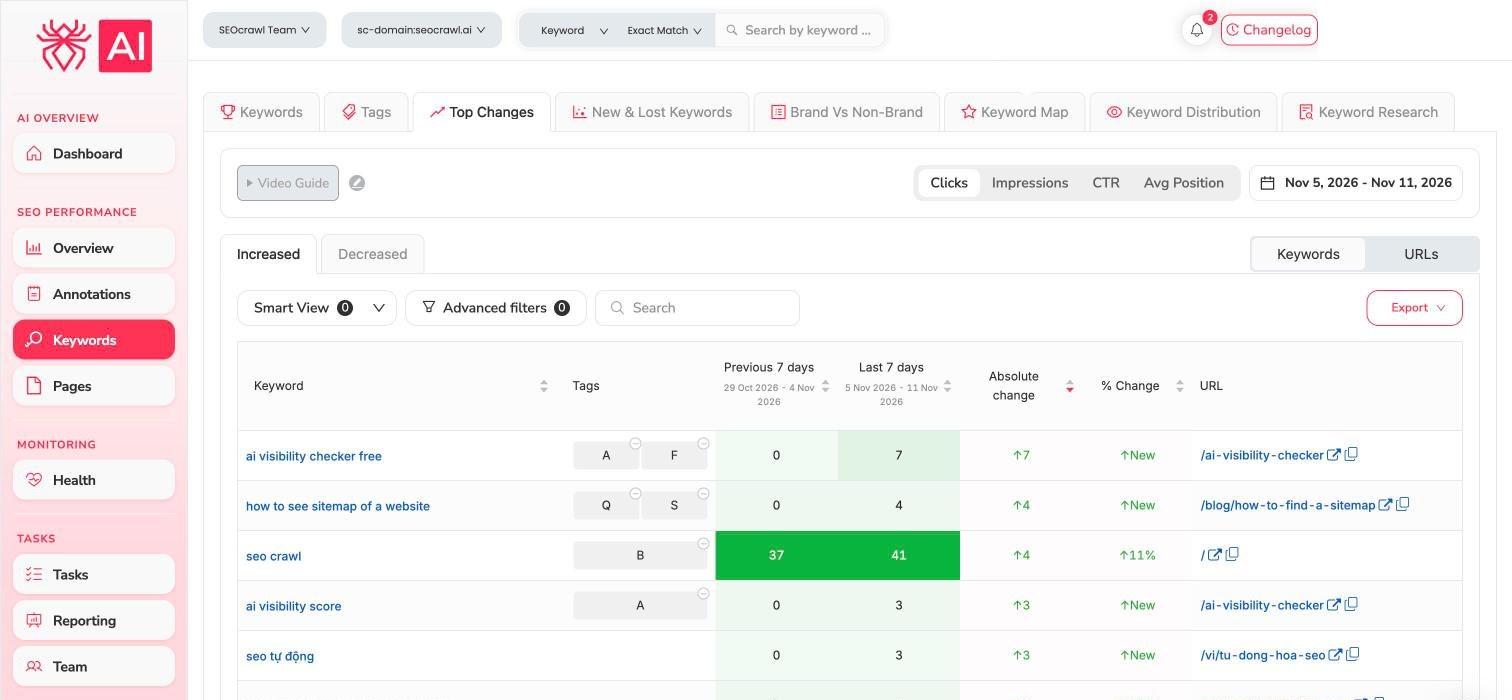
- Switch between Increased and Decreased to see winners and losers.
- Choose the metric at the top: Clicks, Impressions, CTR or Avg Position.
- Switch between Keywords and URLs to see the same changes by page.
- Use Smart View, Advanced filters or the search box to narrow the list.
A keyword that went from 0 to 7 clicks shows as New. Check the URL column: it tells you which page earned the clicks.
New & Lost Keywords: what appeared and what disappeared
Select New & Lost Keywords. The New Keywords and Lost Keywords tabs list queries that started or stopped appearing in the period.
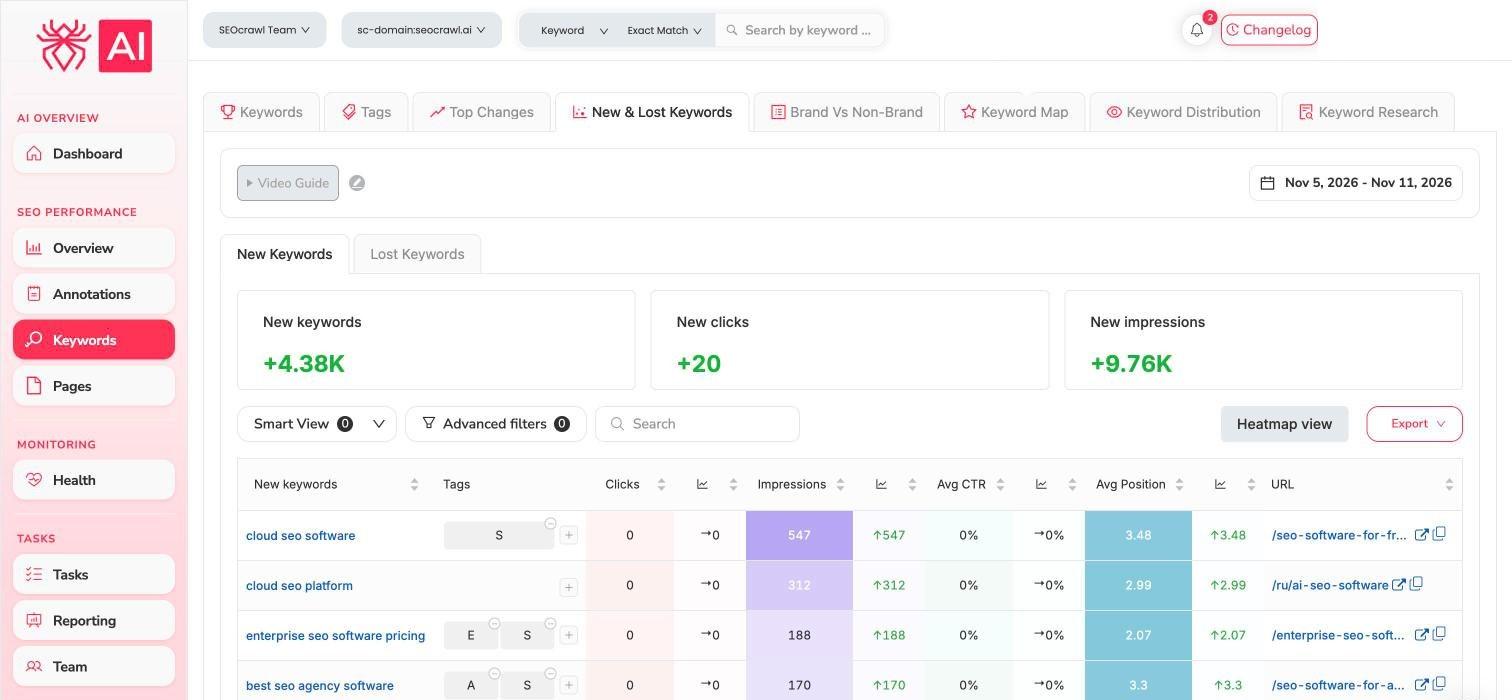
The cards at the top total the new keywords, clicks and impressions. Use Heatmap view to read the table by colour.
Brand vs Non-Brand: where your traffic really comes from
Select Brand Vs Non-Brand to split clicks, impressions, CTR and average position between queries that include your brand and those that do not.
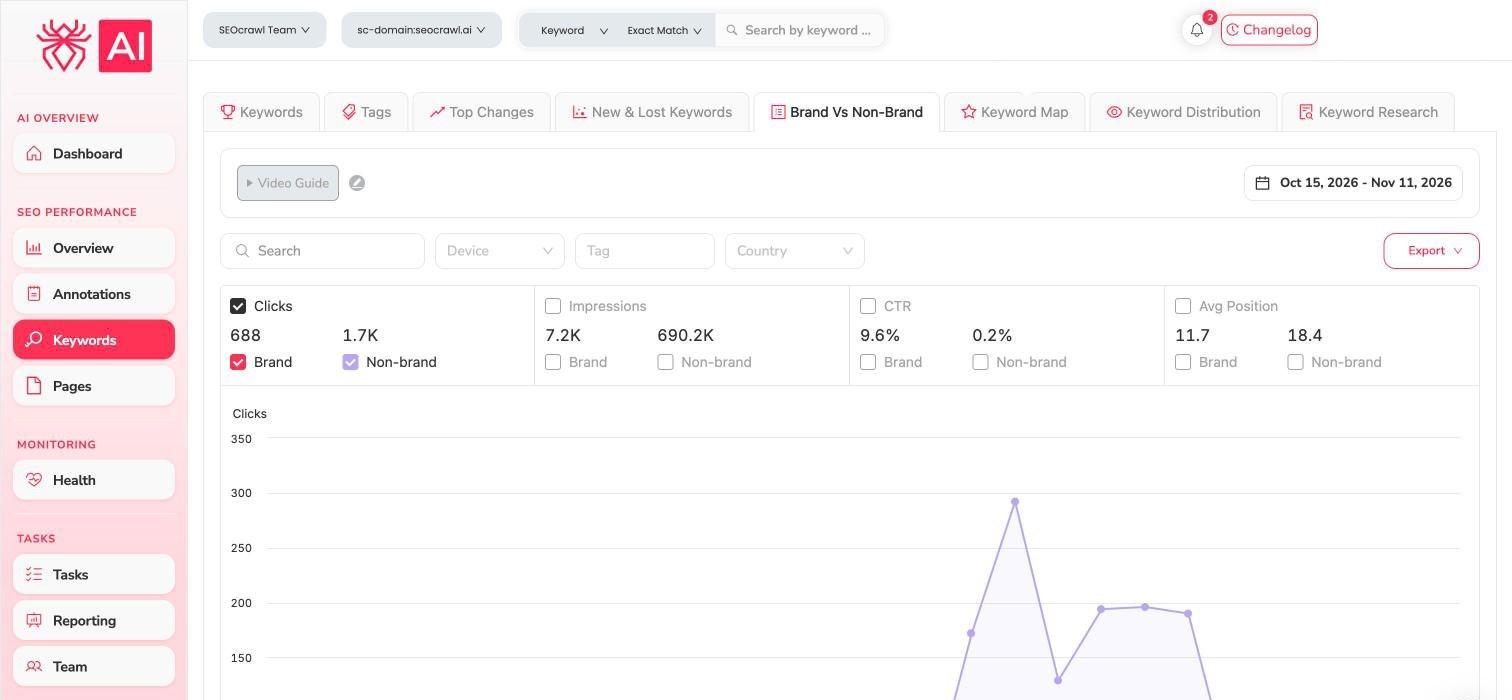
Tick the metric you want to chart and compare the two lines. You can filter by Device, Tag and Country. A site that lives on brand searches is fragile; growing non-brand clicks means you are reaching people who did not know you yet.
Keyword Map: demand, timing and groups
Select Keyword Map to see your keywords together with their search demand from Google Ads.
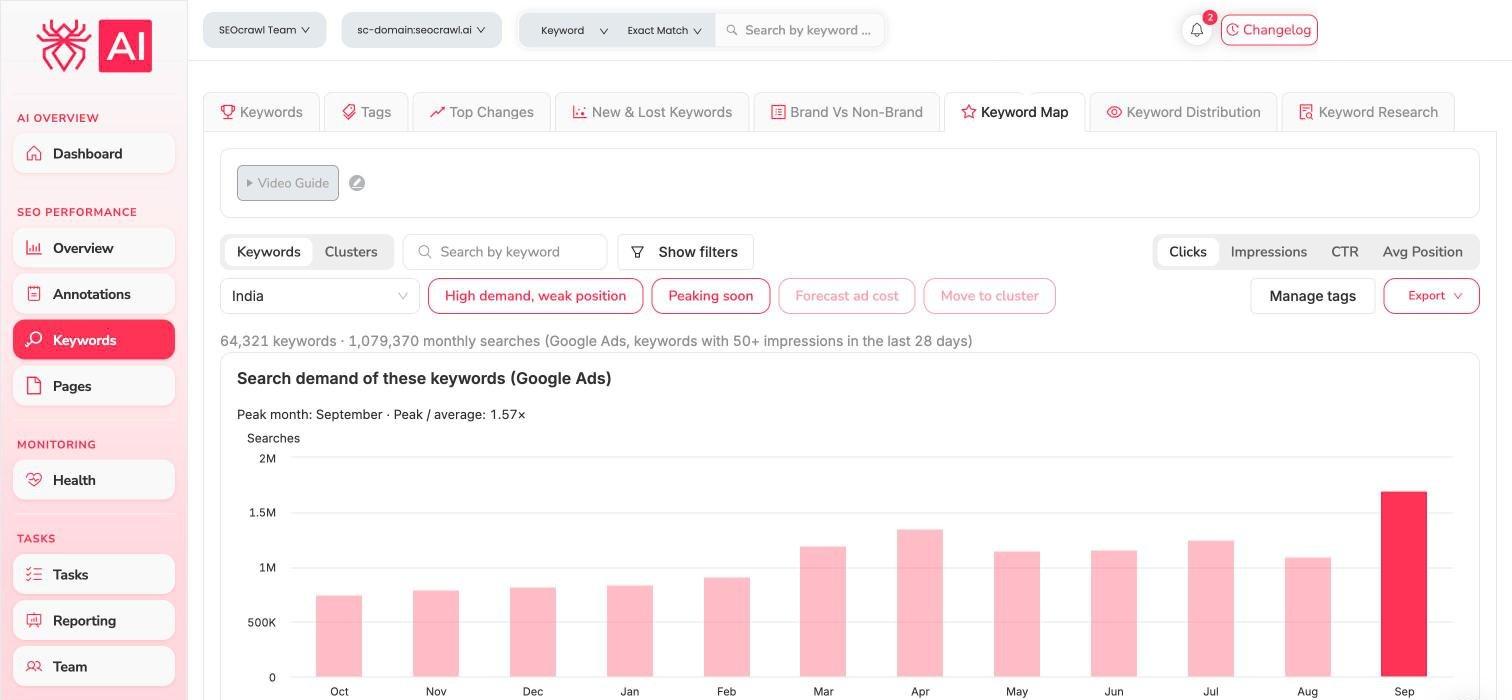
- Choose a country and switch between Keywords and Clusters.
- The summary line counts the keywords included, those with 50 or more impressions in the last 28 days, and their monthly searches.
- The chart shows the peak month and how far it rises above the average.
- High demand, weak position and Peaking soon are quick filters for opportunities.
- Also on this tab: Forecast ad cost, Move to cluster, Manage tags and Export.
Ask your assistant
With the MCP connected you can ask “Which keywords gained the most clicks in the last 7 days?” or “Find keyword opportunities for my site”. See MCP prompts and workflows.
Related guides
- Keywords and rankings
- Pages, folders and keyword cannibalization
- Annotations: note what you changed, then check the effect here.