What Is Average Position in Google Search Console?
It looks like a simple ranking. It isn't.
Average position is the average rank your site held in Google's results for the queries and dates you're looking at, where 1 is the top spot. It is one of the four core Google Search Console metrics, alongside clicks, impressions, and click-through rate.
It is probably the most misread number in the whole report. Because of how Google builds it, a falling average can sometimes mean things are going well, and a healthy-looking one can hide real problems. Here is how it is calculated, where it distorts reality, and how to read it without drawing the wrong conclusion.
What average position actually means
It answers one question: on average, how high did a link to your site sit in the results over the period you selected? The scale starts at 1 for the top organic spot and runs down from there. You can view it four ways in Search Console: for the whole site, for a single page, for a single query, or for a query on a specific page.
Important: it is an average, not a live ranking. The position you see when you Google yourself will often differ from the number in the report, because personalization, location, and short-lived visibility all shift what any single person sees.
How Google calculates it
The mechanics are worth getting exactly right, because every misreading traces back to them.
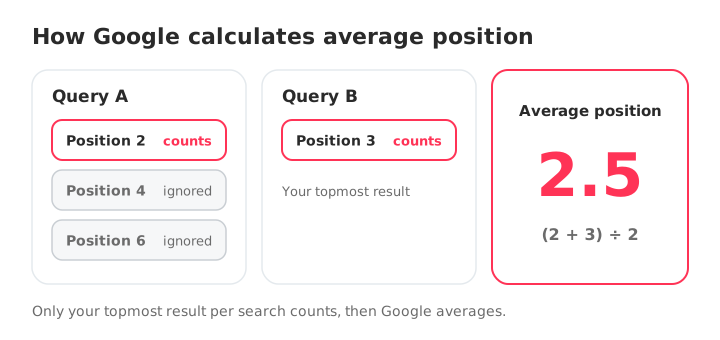
1. It uses your topmost position per search. If your site appears several times for one query, Google records only your highest spot. Show up at positions 2, 4, and 6 for a search, and it counts 2. Everything below your best result is ignored for this metric.
2. It averages those top spots across impressions. Google then averages those topmost positions across every search where you earned an impression. Its own example: one query counts as 2, another counts as 3, so the average position is 2.5. A result has to be seen to count, so a listing sitting on page 3 that no one scrolled to is not recorded, and you will sometimes see a dash instead of a number. The full method is in Google's official Search Console documentation.
3. It is weighted by impressions. A query you appear for thousands of times pulls the average far harder than one you appear for twice. High-frequency queries dominate the number, which is the root of most of the confusion below.
SERP features count as positions
Each organic result counts as one position, and so does each special element such as an AI Overview, an image pack, or a People Also Ask box. Ads and sections with no external links occupy no position. As the results page fills with features, the same blue-link rank can report as a lower position than it used to.
Why it's so often misleading
The definition is clean. The trouble starts when people read the single site-wide number as if it were a live ranking. A few concrete ways it distorts reality:
The topmost-only rule flatters you
If your homepage ranks 3 for a query and a blog post ranks 40 for the same query, only the 3 counts. Your average can look healthier than your pages actually are, because every weak URL that also ranks is quietly excluded.
New content drags it down while nothing broke
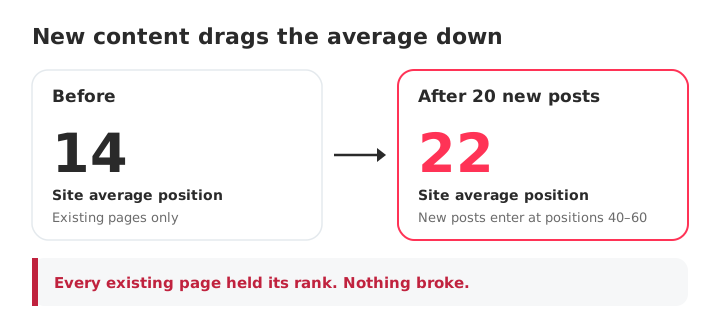
Say you publish 20 posts in a quarter and they enter at positions 40 to 60 as they get indexed. Your site average "worsens" from 14 to 22, and it is tempting to panic. But if every existing page held its rank, nothing broke. The average moved because you added a batch of new, still-climbing pages to it.
One big query masks many small ones
Because the metric is impression-weighted, a single high-volume query parked at position 2 can hide a slow decline across dozens of secondary queries. The headline number holds steady while the long tail slips underneath it.
Filtered and unfiltered tell different stories
The site-wide average blends queries, pages, countries, and devices you may not care about equally. A branded search you always win at position 1 inflates the aggregate. Filter down and the picture can change completely.
What counts as a "good" average position (and why the question is off)
There is no universal good number, and the site-wide average is the wrong thing to chase. Since Google shows roughly 10 results per page, an average of 25 puts you around page 3 on average, and an average of 8 lands you near the bottom of page 1. Useful as a rough gut check, useless as a target.
The better question is not "is my average good," it is "where do my important queries and pages actually sit." A page holding position 6 on a high-intent commercial query is worth more than a site average of 4 propped up by branded searches. Judge position where the money is, not in aggregate.
How to read it correctly
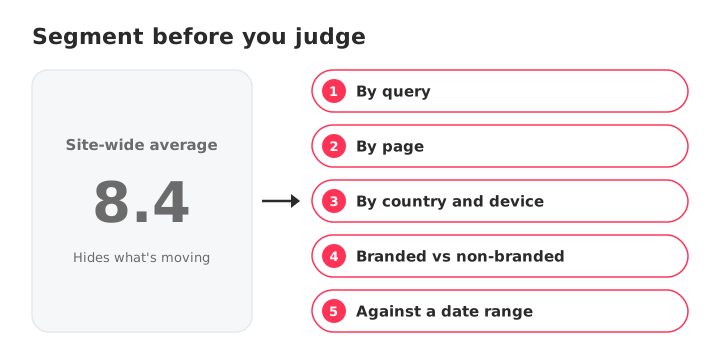
The metric becomes trustworthy the moment you stop reading the top-line number and start segmenting. In the Performance report, enable the Average position toggle, then break the data down:
- By query: sort by impressions or clicks and read position per query, not the site average. This is where real movement shows up. Our guide to Search Console keywords covers this view in depth.
- By page: see which URLs actually carry visibility, and catch cannibalization when two URLs alternate for the same query.
- By country and device: a global average can hide one market improving while another slides, and mobile and desktop often rank differently.
- Branded vs non-branded: separate brand searches so they don't inflate the picture of your organic reach. A regex filter does this in one step.
- Against a date range: compare periods so you read direction, not a single snapshot.
The metrics to read alongside it
Position on its own is half a story. Read it next to the metrics that tell you whether that rank means anything:
- Impressions: how much visibility a query actually has. A great position on a query with five impressions is noise.
- Clicks and CTR: whether the position turns into traffic. Positions 5 to 15 with high impressions and weak CTR are your fastest wins.
- Position distribution over time: whether you are trending up or down, which a single average smooths away.
This is where SEOcrawl AI comes to the rescue. Instead of one blended figure, its Rank Tracker keeps position history per query and per page over time, so you see direction and distribution rather than today's snapshot.
You can tag and cluster queries by rules, by hand, or through the SEOcrawl MCP, then read position per cluster, per country, and per device, and split branded from non-branded in a click.
SEOcrawl AI stores your Search Console data without the 16-month window or the 1,000-row cap, so you can compare periods and catch a slow slide the site-wide average would hide. Pair that with the click-through rate view to find the pages that rank well but under-earn their clicks.
FAQs
What is a good average position in GSC?
There is no single good number. As a rough guide, an average near 1 to 10 means you typically appear on page 1, and 25 puts you around page 3.
But the site-wide average blends every query and page, so a "good" aggregate can still hide weak rankings on the queries you care about. Judge position query by query and page by page instead.
How is average position calculated?
For each search, Google takes your topmost position, even if your site appears more than once, then averages those top positions across every search where you got an impression. In Google's own example, one query counted as 2 and another as 3 gives an average of 2.5. It is weighted by impressions, so frequent queries influence it most.
Why is my average position so high or low?
A worsening average often means new or low-ranking pages entered the mix, not that existing pages dropped. A strong average can be propped up by a few high-volume queries or branded searches. Segment by query, page, country, and device to see what is actually moving before reacting.
Is average position the same as ranking?
No. A ranking is where a specific page sits for a specific query at a moment in time. Average position is an aggregate over many searches, weighted by impressions and affected by personalization and location, so it rarely matches the live rank you see when you search yourself.
Author: David Kaufmann

I've spent the last 10+ years completely obsessed with SEO — and honestly, I wouldn't have it any other way.
My career hit a new level when I worked as a senior SEO specialist for Chess.com — one of the top 100 most visited websites on the entire internet. Operating at that scale, across millions of pages, dozens of languages, and one of the most competitive SERPs out there, taught me things no course or certification ever could. That experience changed my perspective on what great SEO really looks like — and it became the foundation for everything I've built since.
From that experience, I founded SEO Alive — an agency for brands that are serious about organic growth. We're not here to sell dashboards and monthly reports. We're here to build strategies that actually move the needle, combining the best of classical SEO with the exciting new world of Generative Engine Optimization (GEO) — making sure your brand shows up not just in Google's blue links, but inside the AI-generated answers that ChatGPT, Perplexity, and Google AI Overviews are delivering to millions of people every single day.
And because I couldn't find a tool that handled both of those worlds properly, I built one myself — SEOcrawl AI, an enterprise SEO intelligence platform that brings together rankings, technical audits, backlink monitoring, crawl health, and AI brand visibility tracking all in one place. It's the platform I always wished existed.
Discover more content about this author