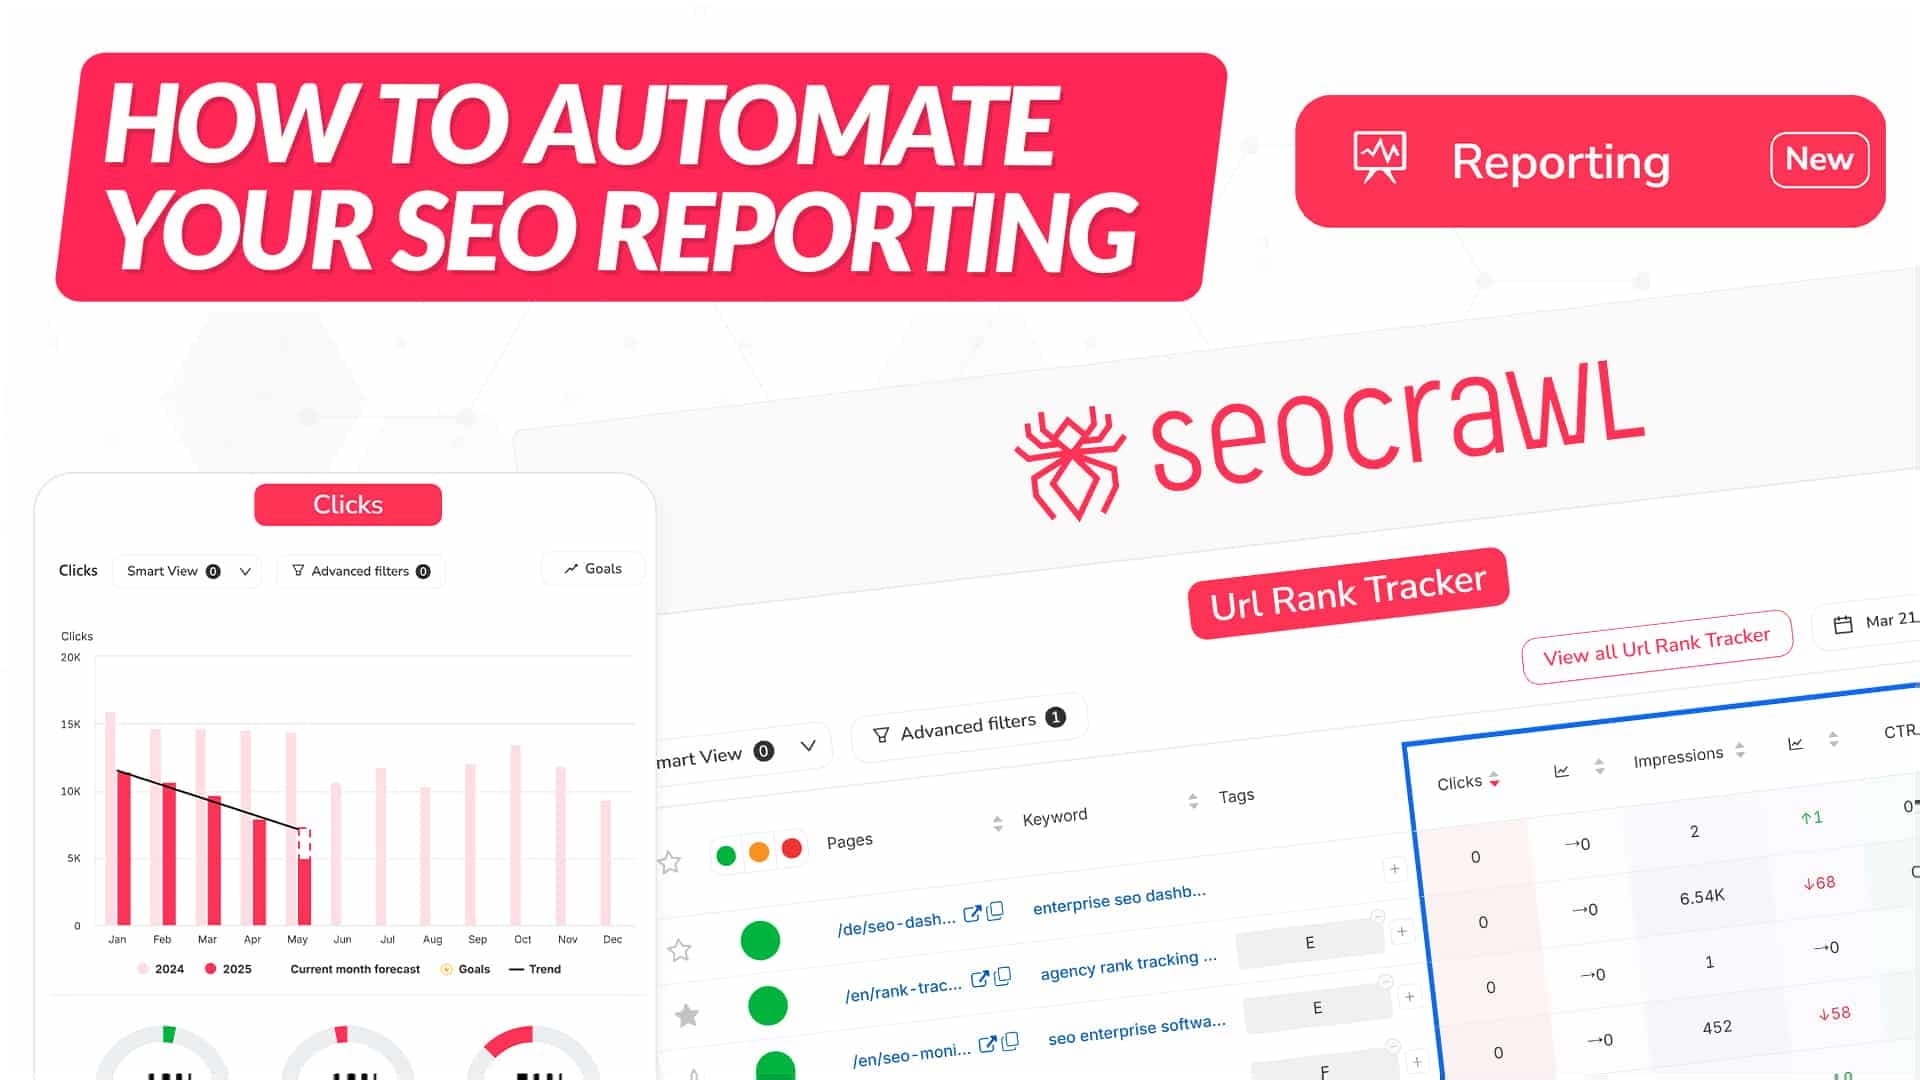
How to Automate your SEO Reporting Step by Step
There’s no doubt that AI tools are going to reshape the years ahead. However, for certain processes, experience and a genuine willingness to help can be far more powerful. That’s exactly what I aim to address in this article: creating a guide to explain how to automate SEO reports using 100% real and accurate data helping us save dozens of hours each month, maintain quality, and, most importantly, allow us to spend that time on strategy, implementation, or areas where we can truly add value.
What Is the SEO Report Automator Based On?
One of SEOcrawl’s greatest strengths is that it acts as a Data Warehouse, meaning it can store all the data from Search Console and Google Analytics 4 without limits and with complete accuracy. Many of these data points were already available in the Dashboard or in specific sections (Top Changes, Countries, etc.). However, the idea behind this new system is to make all these widgets available in a dedicated Reporting module, allowing you to create your perfect SEO report.
All we need to do to access this system is click on “Reporting” in the main menu. On this page, we’ll find three options:
-
Automations
-
Templates
-
New Report
We’ll start with the “New Report” section, which allows us to create a report from scratch and fully automate it.
What Elements Should an SEO Report Include?
The goal of any SEO report should be absolute transparency in other words, clearly and accurately showing the previous situation, what actions have been taken, and the current state, whether it’s positive or negative. Until now, most reports created by SEO professionals and agencies have been done in:
-
Google Slides
-
Looker Studio
However, this process was tedious and consumed a great deal of valuable time just to gather data, format it, and present it properly. That’s why, at SEOcrawl, we set out to change this situation and create a tool that could solve it. Let’s take a look!
This is the most delicate and important part of an SEO report, as it involves organizing all the information that the company or client will receive. To make this process easier, we’ve grouped all the widgets into categories and we’ll also show you how we’ve built our own SEO report within SEOcrawl.
Once it's created, all that’s left is to go into the SEO Report and start working your magic.

As you’ll see, you have a wide range of options all designed in a simple and intuitive way so you can easily build your perfect SEO report according to your specific needs (local business, international company...).
To help you as much as possible, I’ll explain each widget in detail, following the same order we used to create the SEO report for SEOcrawl, along with notes for each section.
Traffic Evolution
The first thing we want to look at is the traffic evolution over the past 24 months to understand trends, seasonality, and, most importantly, progress over time.

In our case, we’re interested in keeping a global view of all countries and all URLs, which is why we haven’t applied any filters. However, if we want to, we can apply a filter to view only the traffic from a specific country or a particular business vertical.
Visibility Evolution
The impact of AI Overviews is significant, and one of the key things we’ll notice is an increase in impressions if our results are useful alongside a decrease in clicks and CTR, as more and more users accept the AI-generated answers without paying attention to the sources or digging deeper.

In our specific case, you can see that in terms of traffic, we’re experiencing a slight downward trend. However, when it comes to impressions, we continue to grow steadily both month over month (MoM) and compared to the previous year (YoY).
Short-Term Performance and Insights
One of the most important features of this reporting system which we’ll explore in more detail later is that it can be configured on a weekly and/or monthly basis. This way, we can gain short-term insights into significant changes, as well as a more strategic, long-term view on a monthly level either in separate reports or combined into one.
To analyze this in detail, we have several widgets available, such as Top Changes and Keyword Distribution.
Top Changes
The Top Changes widget shows us the most significant variations both positive and negative of the keywords and URLs in our project. This allows us to quickly identify what’s growing the most and what’s declining, so we can take action accordingly.

Keyword Distribution
Whether due to a Google algorithm change (Core Update) or simply to measure our performance against competitors, the Keyword Distribution widget allows us to see which keywords we rank for in each position. Most importantly, it helps us track whether we’re gaining or losing positions in the top 3 and 4–10 ranges the two most critical groups.

Note: The only important thing to keep in mind here is that a country filter is required to view the results properly segmented and accurate. Without it, the system will compare keyword positions from all countries at once.
Top Performance
This is arguably one of the most important widgets. In a single table, we can see the most important keywords and URLs of our project and how they fluctuate positively or negatively. This is the core of our system, and without it, any company could face serious challenges in terms of growth and revenue.
By default, I recommend displaying the top 10 or top 25 to ensure clear and effective visibility.

However, there’s an even better approach: duplicating this widget to display one version with the global top 10/25, and another focused specifically on our CORE or business-critical keywords. This ensures that the keywords and URLs we know generate revenue are always monitored and under control.
Additionally, we can toggle between several variables clicks, impressions, CTR, or average position to display exactly the metrics we need to analyze.
If in these views we have keywords and URLs combined, but want to analyze them separately, we also have the Top Keywords and Top URLs widgets. These display all the information individually, filtered, and precisely.
Top Keywords
The keyword rank tracker is one of the most informative widgets, and we can duplicate it as many times as needed to view data by country, keyword type, tags, and more. For example, in our case, we created a smart view that excludes brand keywords and keywords containing “map” to filter out all those related to the article “How to find a sitemap,” which generates a lot of traffic but few conversions.

URL Rank Tracker
Just like with the URL rank tracker, this widget allows us to filter by country and URL type (e.g., eCommerce vs. blog), giving us a 100% accurate view of what’s happening. Additionally, we can view combined SEO data from Search Console alongside behavioral and conversion data from Google Analytics 4.

International SEO
If we’re working on a project where the company operates in just one country, it’s very simple we just apply the country filter on each widget and get all the data we need. However, if we operate across multiple countries, a wide range of possibilities opens up for us:
-
Create a widget for each country (if there are only a few countries)
-
Create a report with all the data and then duplicate it for each country.
Each company’s needs will determine the path to follow. However, one thing is clear: the "Top Countries" widget will allow us to have all the data instantly.

Keyword and URL Map
The keyword and URL map widgets may not be used as regularly as the others, but at a quarterly analysis level or when analyzing “target” URLs and keywords, they can be among the most important, as they allow us to visually see their evolution over the last 12 months.


If you look closely, you'll see that in each widget and in every part of the report, insights and actionable next steps are already being visualized.
-
Why did the URL of the article "How to find a Sitemap" have almost 10k organic clicks in July of last year and now barely reaches 4k?
-
Why did we gain traffic in certain months on the English version "/en"?
All of this is what we’ll be noting down to draw conclusions and turn all this data into improvements for our business. But there’s still much more to cover, so let’s keep going!
Brand vs Non-Branded
Seeing the evolution of the website's global traffic without understanding what it’s made up of won’t be useful at all. For this reason, the "Brand vs Non-Branded" system will allow us to see how many people are searching for our brand vs our services.

New and Lost Keywords
Before we start getting traffic, Google usually rewards our quality content with visibility that is, impressions. It places us in positions 7–10 because it sees potential value but isn’t yet sure if we deserve to be in the top 3 or even now in the AI Overviews. To understand which content Google likes and we should reinforce with...
-
Internal Linking
-
Link Building Campaigns
-
Content improvements, videos, infographics...
We have the report on new and lost keywords, which will tell us which keywords and URLs were not ranking and have now gained significant visibility, and vice versa which keywords and URLs we had ranked and have now lost, to understand the reasons behind their drop.

Annotations
If there’s one module that should NEVER be excluded, it’s the annotations module. It will not only tell us how each Google Core Update has affected us, but more importantly, what impact the actions we’ve taken on our website throughout the week or the entire month have had. This way, we can understand the relationship and ROI between the effort invested and the results achieved.

Of course, there are many other widgets:
-
questions
-
devices
-
opportunities
-
tasks
-
....
And many more that we will be adding and updating throughout the year. However, I didn’t want to close this article without first introducing two essential sections.
Text and Image Modules
These two modules are VITAL, as they will allow us, on one hand, to add context about the things that are happening:
-
To explain the drop in traffic because the website was down for 4 days
-
To explain the 1000% increase in traffic because we appeared on TV

And even add data from external tools if we want to complement that report with information we believe may be relevant.
This way, we can create our perfect SEO report with all the insights we need. Now, the most important part is that this report will be generated automatically with all the data updated every week or every month. All we have to do is click on “Automate” and choose which team members will receive it.
My personal recommendation is that we always include ourselves and our team, review all the data, create one or several text widgets with Insights and Next Steps, and then share it with the client.
How to share this SEO report?
As I explained, one of the simplest ways would be to include our client/company once we configure the “Automate Report” option. However, we offer all professionals a wide range of tools to choose the one that best suits their needs.

-
PDF Download: a PDF file with our own branding, which means it includes our company’s logo and corporate colors.
-
Interactive link: a link we can share with our team/client, and they will see a “presentation-style” view without any editing tools.
-
Protected link: the same as the previous point, with the only difference being that we’ll need to set up a password in case we want to add an extra layer of security to the report.
With the goal of allowing you to see a real report with real data and, above all, how it looks, we’ve made the SEOcrawl data available to you in PDF format so you can see just how polished it can be.
Author: David Kaufmann

I've spent the last 10+ years completely obsessed with SEO — and honestly, I wouldn't have it any other way.
My career hit a new level when I worked as a senior SEO specialist for Chess.com — one of the top 100 most visited websites on the entire internet. Operating at that scale, across millions of pages, dozens of languages, and one of the most competitive SERPs out there, taught me things no course or certification ever could. That experience changed my perspective on what great SEO really looks like — and it became the foundation for everything I've built since.
From that experience, I founded SEO Alive — an agency for brands that are serious about organic growth. We're not here to sell dashboards and monthly reports. We're here to build strategies that actually move the needle, combining the best of classical SEO with the exciting new world of Generative Engine Optimization (GEO) — making sure your brand shows up not just in Google's blue links, but inside the AI-generated answers that ChatGPT, Perplexity, and Google AI Overviews are delivering to millions of people every single day.
And because I couldn't find a tool that handled both of those worlds properly, I built one myself — SEOcrawl, an enterprise SEO intelligence platform that brings together rankings, technical audits, backlink monitoring, crawl health, and AI brand visibility tracking all in one place. It's the platform I always wished existed.
Discover more content about this author